Silver makes up only a minute fraction of the Sun, but its abundance carries clues about events that shaped the Milky Way. For years, measurements suggested that some of that silver was missing.
Researchers at Uppsala University have now calculated that the Sun contains 55 percent more silver than previously estimated. Their result brings the solar value into much closer agreement with silver measured in chemically primitive meteorites.
The difference arose from the way astronomers modeled the Sun’s atmosphere and the behavior of silver atoms within it. Earlier calculations assumed conditions that were simpler than the physical environment where sunlight forms.
“The new knowledge about the sun’s composition is important for the understanding of other stars, planets and cosmic material, because the sun is one of astronomy’s key reference points,” said Sema Caliskan, who conducted the work during her doctoral studies at Uppsala University’s Department of Physics and Astronomy.
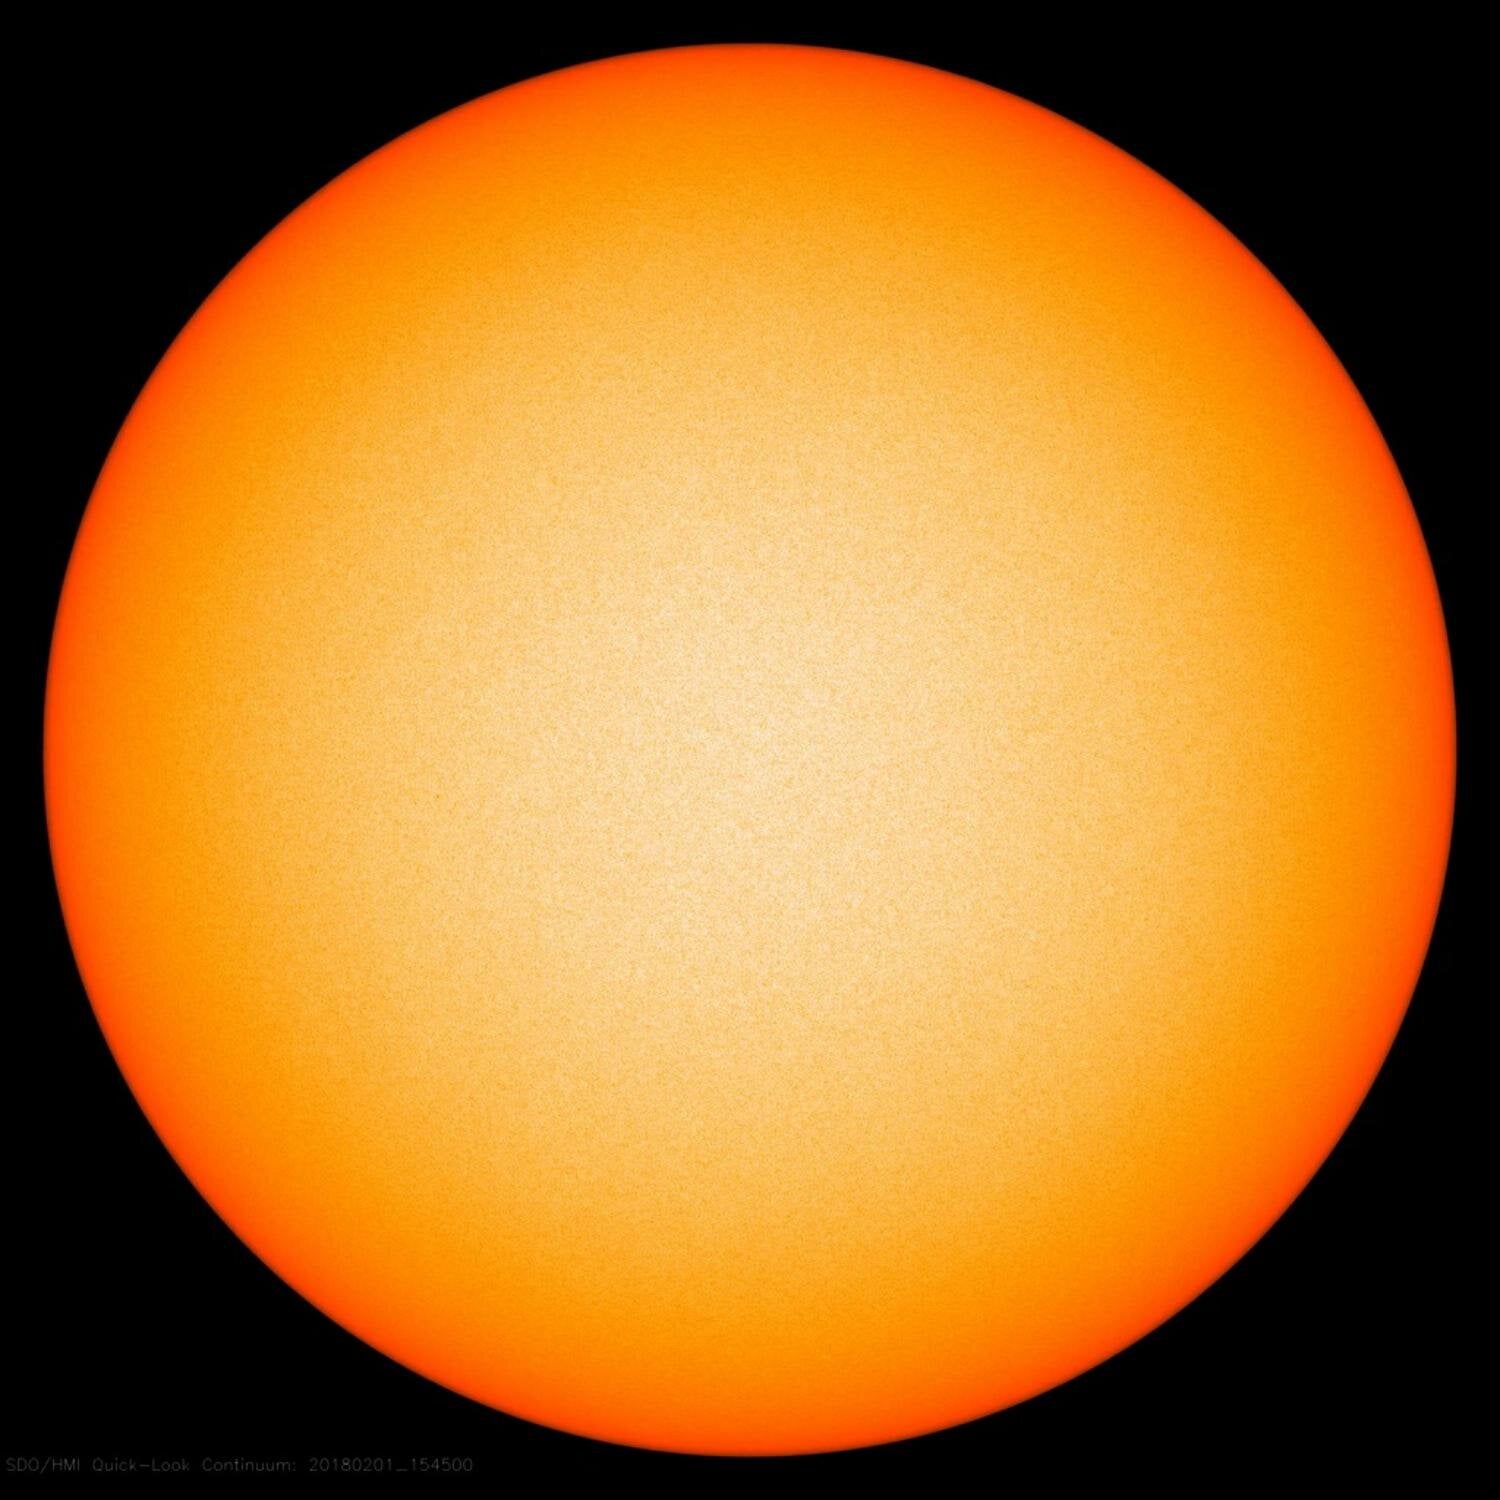
Hydrogen and helium account for almost all the Sun’s mass. Heavier elements, including carbon, iron and silver, make up only about 1.5 percent.
Those trace elements still provide a record of earlier generations of stars. Heavy elements form inside stars and during stellar explosions, then enter the gas and dust that produce new stars and planets.
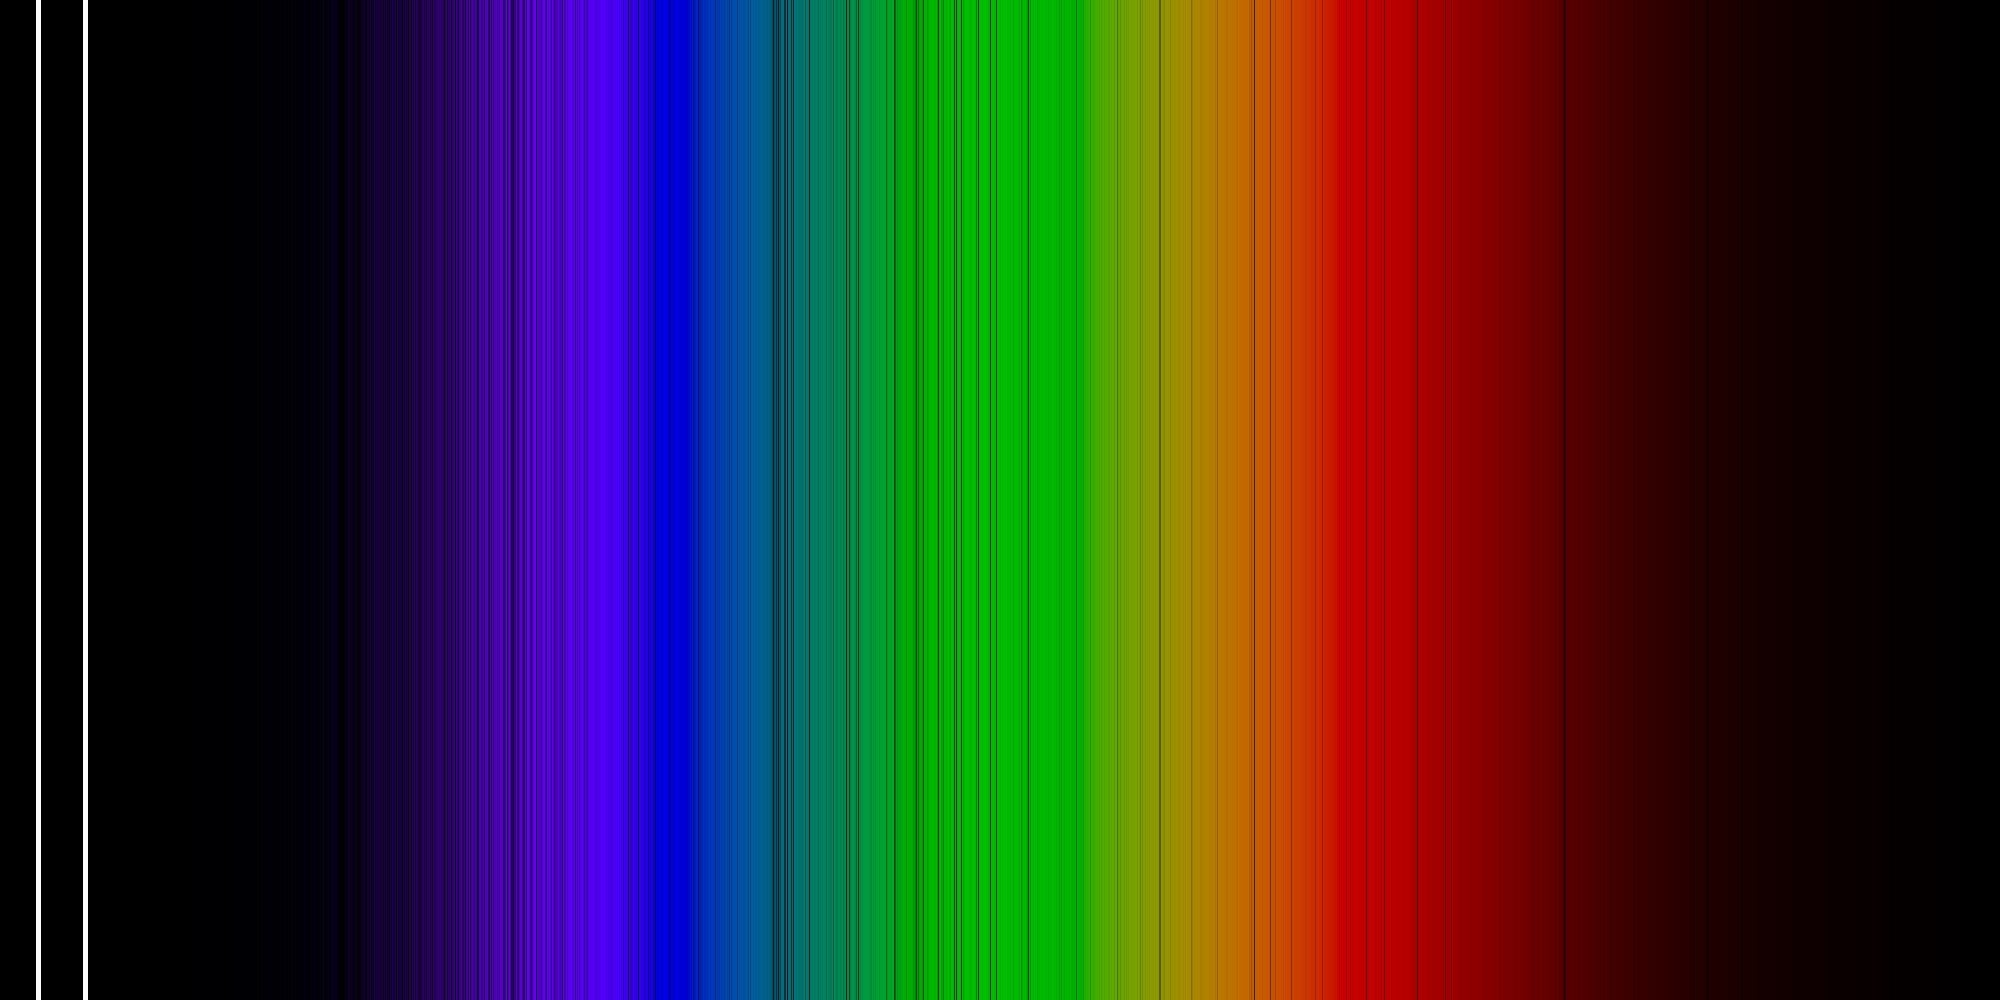
Astronomers determine the Sun’s composition by splitting sunlight into its component wavelengths, a method known as spectroscopy. Atoms in the solar atmosphere absorb light at particular wavelengths, leaving dark features called spectral lines.
Each element creates a recognizable pattern. Scientists compare the observed lines with calculated spectra to estimate how much of an element must be present.
Silver presents an unusual challenge. Only two usable lines from neutral silver atoms can be observed, at wavelengths of 328 and 338 nanometers. Both sit in the near-ultraviolet portion of the spectrum and overlap with signals from other atoms.
The 328-nanometer line is especially crowded and difficult to measure. The 338-nanometer feature is less blended, making it a more dependable indicator.
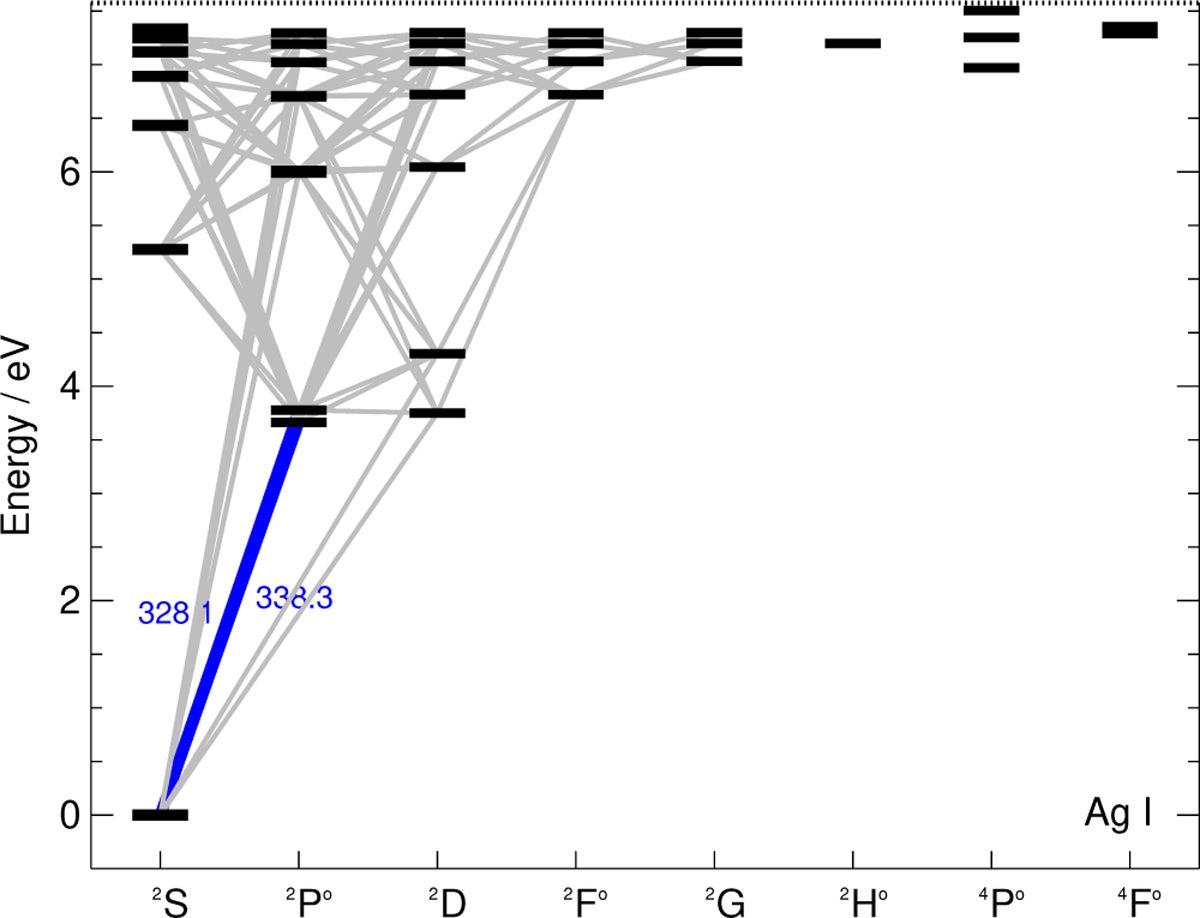
Earlier estimates treated silver atoms as though they existed in local thermodynamic equilibrium. Under that assumption, conditions in each small region of the atmosphere determine the atoms’ energy states.
The new analysis removed that simplifying assumption. Caliskan and her colleagues modeled conditions in which radiation can influence silver atoms across different parts of the atmosphere.
“With our new model, we were able to interpret the spectral lines used to determine the solar silver abundance more accurately,” Caliskan said.
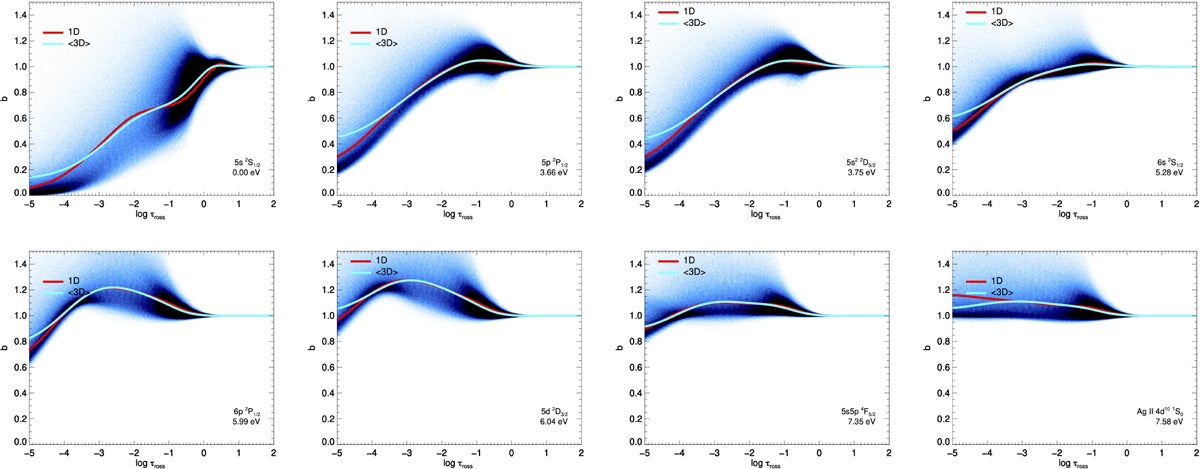
The researchers built the first detailed non-equilibrium model for neutral silver. It contained 57 atomic energy levels and data describing how the atoms absorb radiation, release energy and collide with electrons and hydrogen atoms.
Some of the required atomic information did not exist. The team therefore calculated missing transition data and collision rates before analyzing the solar spectrum.
They combined that atomic model with a three-dimensional simulation of the Sun’s atmosphere. The simulation represented rising hot material, sinking cooler gas and temperature differences across the visible solar surface.
These motions affect the shapes, strengths and positions of spectral lines. Simpler one-dimensional models cannot fully reproduce them.
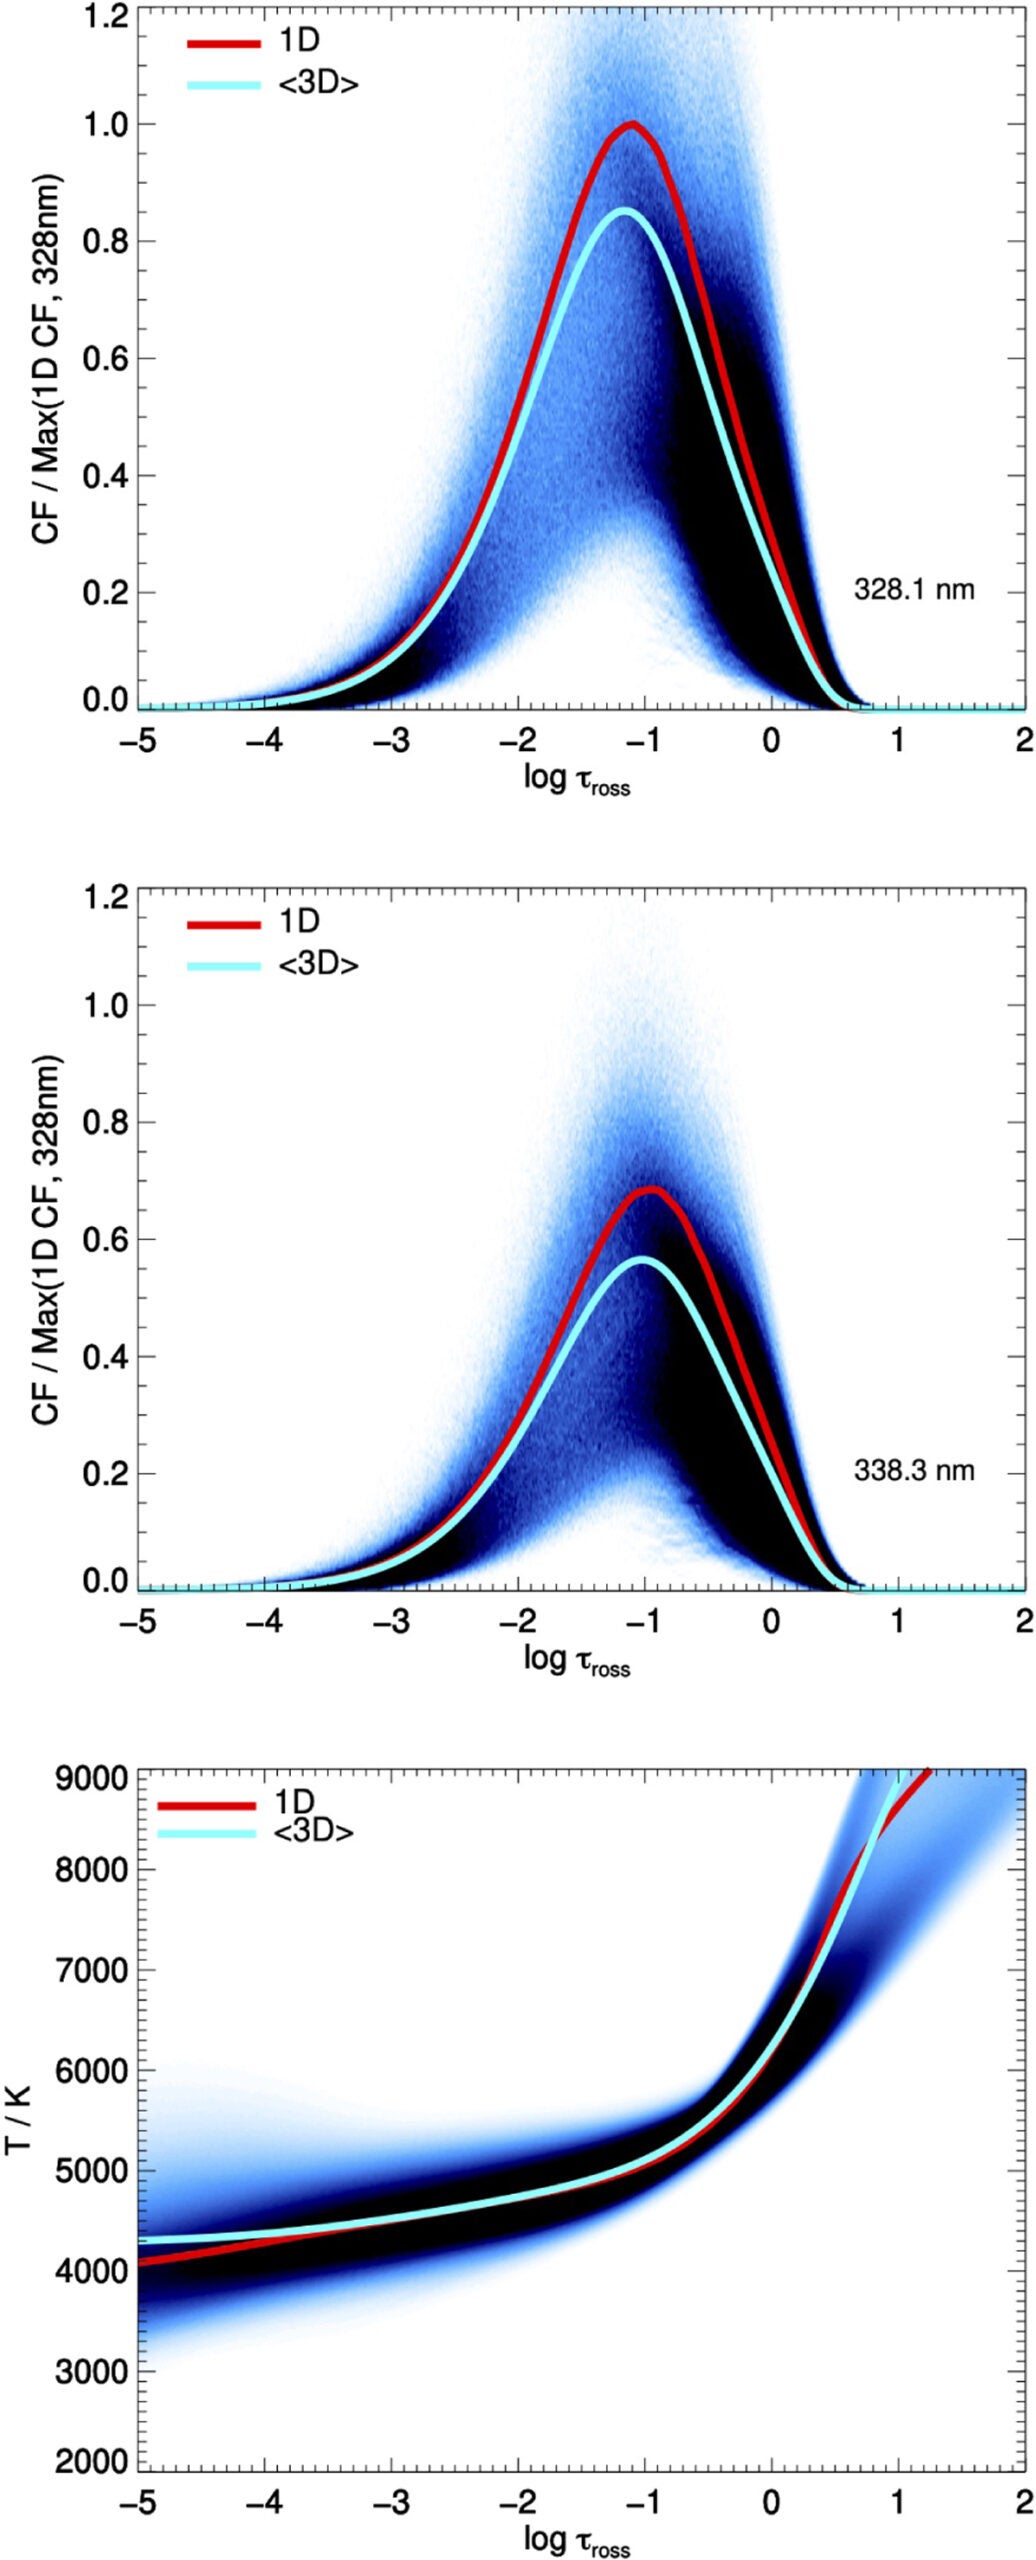
The calculations showed that the two silver lines themselves drive much of the non-equilibrium behavior.
Radiation excites silver atoms from their lowest energy state and redistributes them among higher levels. This process reduces the number of atoms available to absorb light at the diagnostic wavelengths.
As a result, the silver lines become weaker than they would under equilibrium conditions. A weaker line requires more silver to reproduce the feature seen in sunlight.
Three-dimensional atmospheric effects weaken the lines further. The team found that the non-equilibrium effect was larger, but both adjustments moved the abundance estimate in the same direction.
Together, they produced an abundance correction of about 0.28 dex compared with a traditional one-dimensional equilibrium calculation. A dex is a logarithmic unit commonly used to describe chemical abundances.
The researchers also revised measurements of the two silver lines because nearby atomic signals can distort their apparent strength. Their recommended solar silver abundance is log εAg = 1.15, with an uncertainty of 0.08.
The previous recommended value was 0.96, with an uncertainty of 0.10. The difference of 0.19 dex corresponds to an increase of about 55 percent.
The earlier solar measurement stood 0.25 dex below the silver abundance found in CI chondrites. These primitive meteorites preserve material from the early solar system.
The mismatch was puzzling because the Sun and meteorites formed from the same cloud of gas and dust about 4.6 billion years ago. Their silver levels should therefore be broadly consistent.
After the revision, the difference fell from 0.25 dex to 0.06 dex. That remaining gap fits within the estimated uncertainties.
The two solar silver lines also produced much more consistent results under the new approach. Their calculated abundances differed by only 0.02 dex, compared with a 0.175-dex difference in the earlier analysis.
Some uncertainty remains, particularly around collisions between silver and hydrogen atoms. The strength of an overlapping iron line near 328 nanometers also needs better measurement.
The authors said future high-resolution observations could help refine that blend and reduce the total uncertainty below 0.08 dex.
Silver is a neutron-capture element, meaning it forms when atomic nuclei capture neutrons. Nearly 80 percent of the solar system’s silver is thought to come from rapid neutron-capture reactions known as the r process.
Its exact origins remain uncertain. Evidence from older stars suggests that more than one type of r-process event may contribute to lighter and heavier elements.
Silver may help trace the weaker of those proposed processes. However, measurements in other stars have shown wide scatter, partly because the ultraviolet lines are difficult to interpret.
“By studying the light of stars of different types and ages, we hope to understand where silver is formed in the universe and how it has been distributed throughout the Milky Way over time,” Caliskan said.
The revised value gives astronomers a more reliable solar reference when comparing the chemical compositions of stars, planets and meteorites.
Applying the same non-equilibrium method to other stars could reduce errors in silver measurements, especially among metal-poor stars where ultraviolet radiation may produce even larger corrections.
More accurate comparisons could help researchers test whether separate stellar events created different groups of neutron-capture elements. They may also clarify how silver accumulated across the Milky Way before becoming part of the young solar system.
Research findings are available online in the journal Astronomy & Astrophysics.
The original story “The Sun contains 55% more silver than astronomers previously thought” is published in The Brighter Side of News.
Like these kind of feel good stories? Get The Brighter Side of News’ newsletter.
The post The Sun contains 55% more silver than astronomers previously thought appeared first on The Brighter Side of News.