Andromeda has not stopped making stars, but its busiest stellar nursery is losing momentum. A Hubble Space Telescope census shows that the nearby galaxy’s star formation has declined for about 500 million years, then dropped even faster during the past 40 million.
The analysis combines two major Hubble surveys that mapped roughly two-thirds of Andromeda’s star-forming disk. Together, the Panchromatic Hubble Andromeda Treasury and its southern counterpart measured about 200 million individual stars.
That scale matters because stars preserve a galaxy’s history. Their colors, brightness, and masses reveal when different regions were actively producing new suns.
“We need to measure the individual stars because they are the fossil record of the galaxy’s formation. Hubble is the only telescope that can give you high enough spatial resolution over a large enough area to be able to do that in Andromeda,” said Ben Williams, an astronomer at the University of Washington and a study co-author.
Andromeda, also called M31, lies about 2.5 million light-years from Earth. It is similar in size to the Milky Way and visible without a telescope under dark skies.
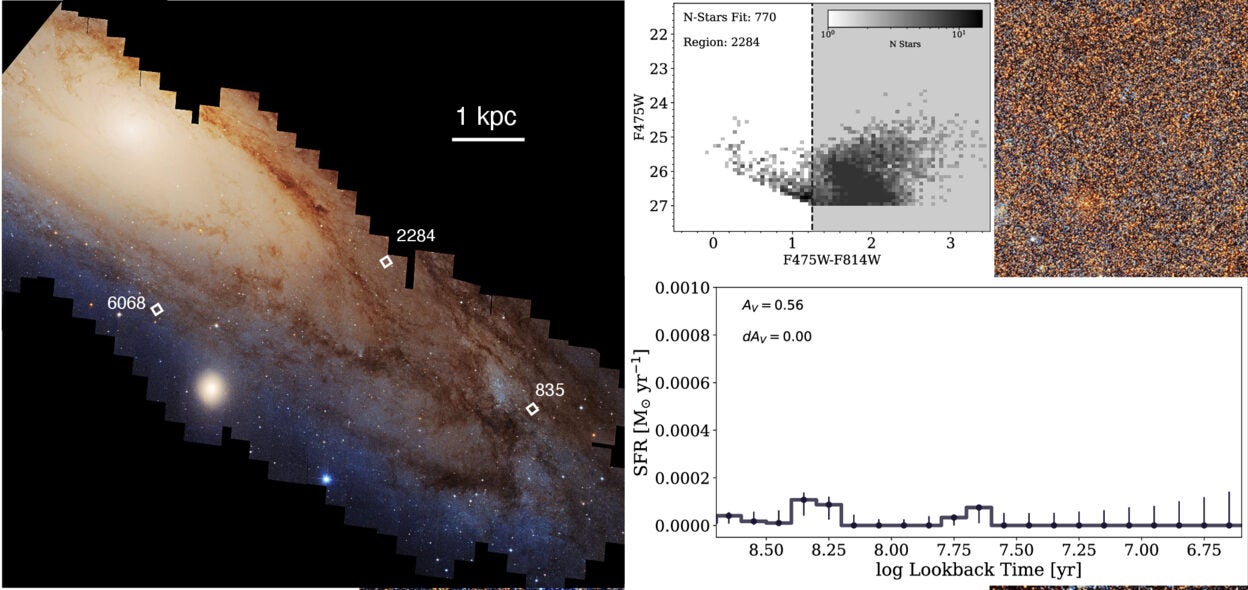
The team divided Hubble’s images into thousands of square regions. Each covered about 300 light-years on a side after accounting for the galaxy’s tilted disk. Researchers then reconstructed the rate of star formation inside every section.
Massive young stars appear blue and die quickly. Redder stars generally live longer. By comparing the numbers and properties of stars in each region, the team estimated when and where Andromeda formed new stellar populations.
The reconstructed timeline shows that Andromeda was forming about one solar mass of stars each year 500 million years ago. By 40 million years ago, the rate had fallen to roughly half that level.
The decline did not affect every part of Andromeda equally.
Much of the galaxy’s recent star formation has occurred inside its 10-kiloparsec ring, located about 32,000 light-years from the center. The ring dominates Andromeda’s recent star-making budget, so reduced activity there strongly shapes the galaxy-wide trend.
Regions away from the ring have generally formed fewer stars and changed more gradually. The global decline therefore reflects the winding down of Andromeda’s most active structure, not a uniform shutdown across the entire disk.
“It’s just like after running a marathon, sometimes you’ve got to take a bit of a breather,” said lead author Tobin Wainer of the University of Washington.
Earlier work found that Andromeda experienced a strong burst of star formation about 2 billion years ago, possibly following a merger or close interaction. The newer measurements suggest the present slowdown is the latest stage of a much longer decline from that active period.
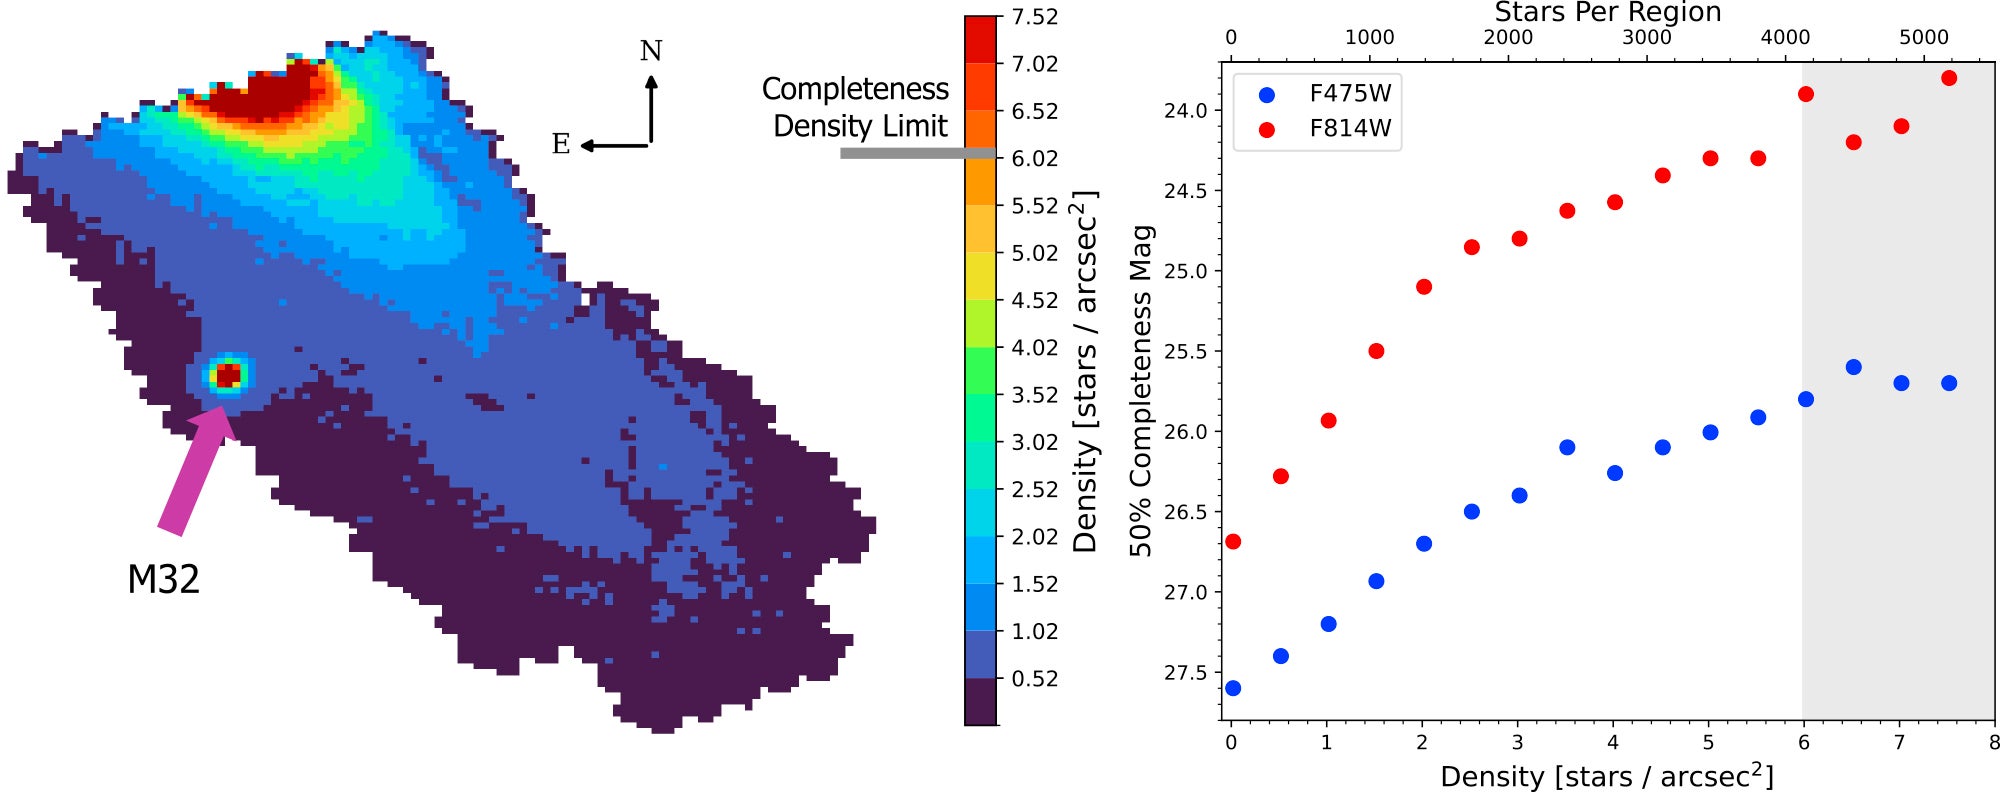
The southern Hubble survey gave astronomers a closer look at the area around M32, a compact satellite galaxy projected near Andromeda’s disk.
M32 appears about 16,000 light-years from Andromeda in the plane of the sky. Its true three-dimensional position remains uncertain, leaving astronomers unsure when or whether it crossed the larger galaxy’s disk.
“One of the major motivations for this program was to probe potential interactions between M32 and Andromeda’s disk,” said University of Washington co-author Zhuo Chen.
The region surrounding M32 followed Andromeda’s average star formation pattern until about 60 million years ago. After that, its rate fell below the galaxy-wide average and remained suppressed.
“We can’t explicitly say that we are seeing a decrease in star formation because of M32. But it’s right there, and it’s definitely the most likely suspect,” Wainer said.
The timing could help future models test possible encounters between the galaxies. However, the authors caution that the decline began earlier than some proposed recent-passage scenarios, so M32 may not provide the entire explanation.
The analysis also exposed problems with standard methods that estimate star formation from ultraviolet and infrared light.
Those methods commonly assume that a galaxy’s star formation rate has remained steady over a set period. Andromeda’s sharp recent decline violates that assumption.
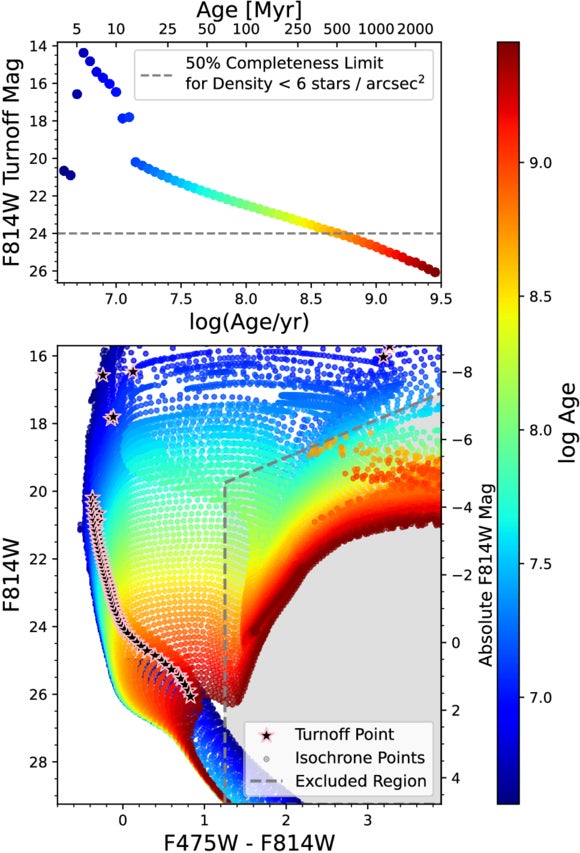
Ultraviolet-plus-infrared estimates produced star formation rates about 2.1 times lower than measurements based on individual stars. Yet when the team used its detailed, time-varying history to create a synthetic ultraviolet image, the result closely matched observations.
Models that imposed a constant rate failed. This showed that ultraviolet light depends not only on how many stars formed during the past 100 million years, but also on exactly when they formed.
The result matters because young, massive stars dominate ultraviolet emission. A galaxy that recently slowed down can therefore look different from one that formed the same total stellar mass at a steady rate.
The combined Hubble maps provide the most complete resolved-star view yet of Andromeda’s recent history. They allow astronomers to connect local structures, including rings, spiral features, and the M32 region, with changes unfolding across hundreds of millions of years.
The findings also show why a single “current” star formation rate can be misleading. Estimates averaged over 100 million years give a different answer from those focused on the latest 20 million years because Andromeda is changing rapidly.
NASA’s Nancy Grace Roman Space Telescope is expected to widen this view. Its much larger field of view can image all of Andromeda’s disk and surrounding halo while still resolving hundreds of millions of stars.
Those observations could test how the ring evolved, clarify the role of M32, and help astronomers understand how large spiral galaxies move from active star formation toward quieter states.
Research findings are available online in the The Astrophysical Journal.
The original story “Andromeda’s star formation has been slowing down for 500 million years” is published in The Brighter Side of News.
Like these kind of feel good stories? Get The Brighter Side of News’ newsletter.
The post Andromeda’s star formation has been slowing down for 500 million years appeared first on The Brighter Side of News.

