The world’s glaciers hold enough ice to raise global sea levels by about 32.3 centimeters if they melted completely. A new study now offers one of the clearest maps yet of where that ice sits and how thick it is.
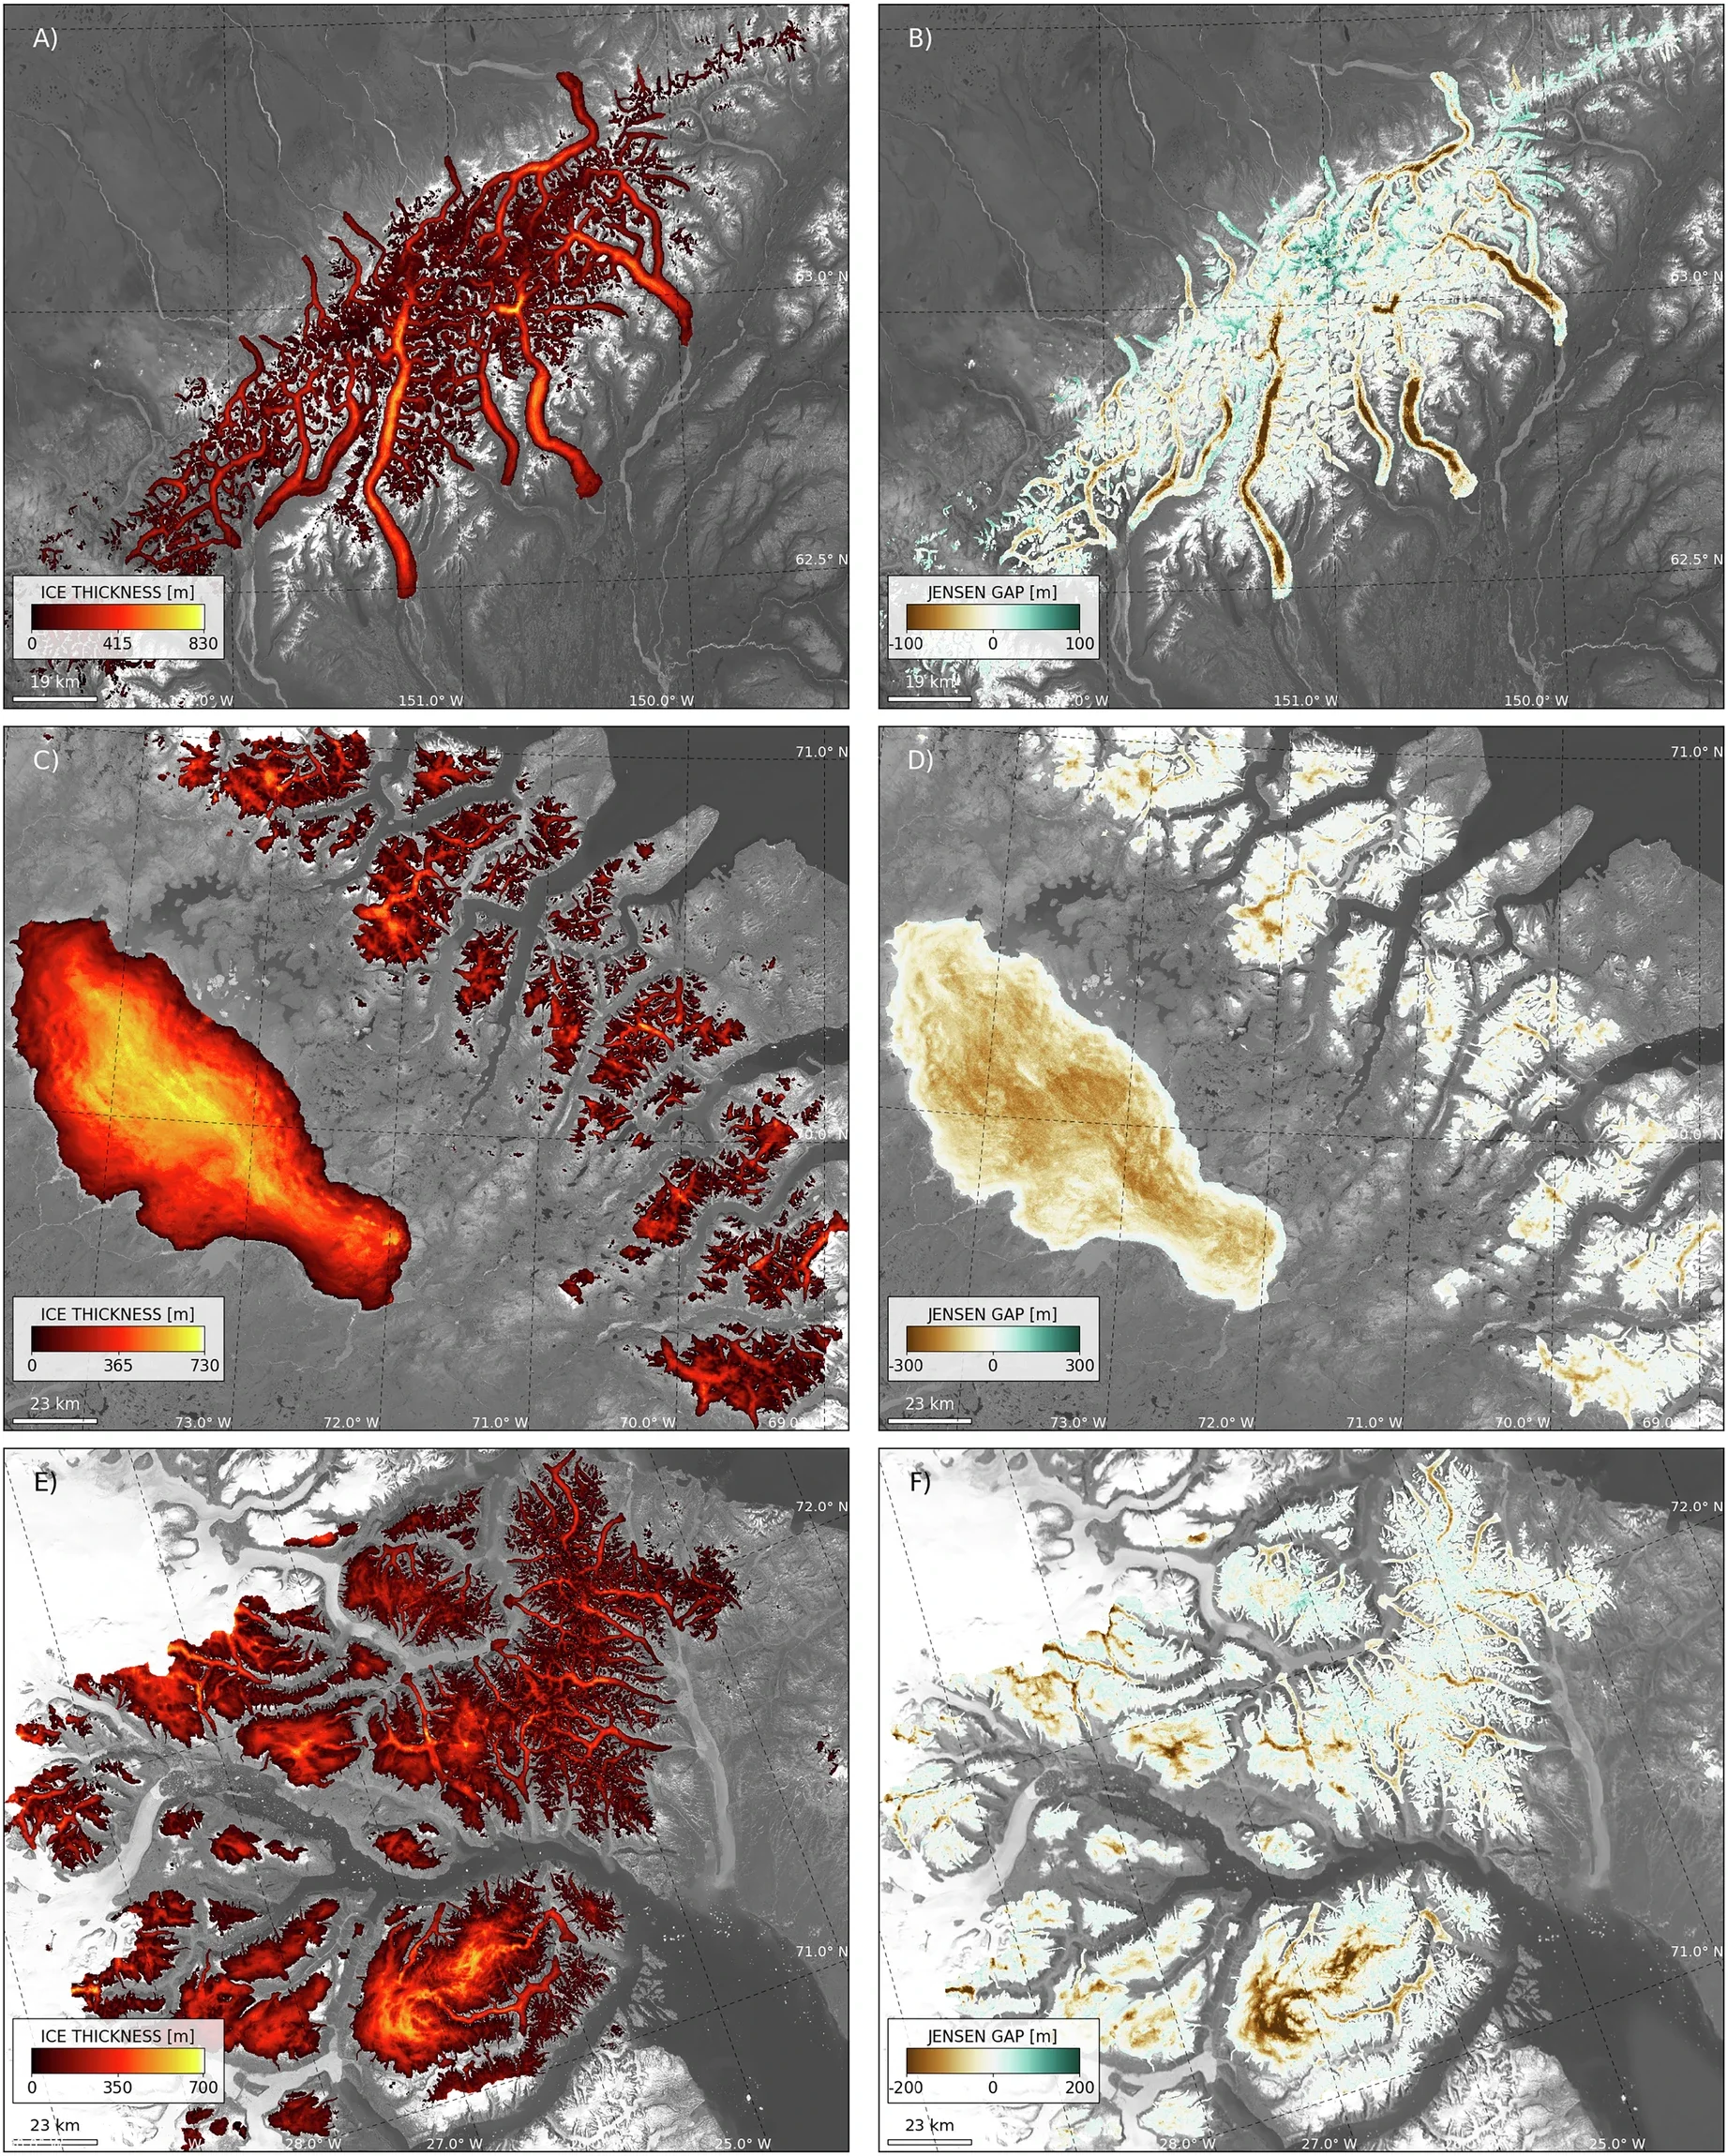
Led by Ca’ Foscari University of Venice, with the Institute of Polar Sciences of the National Research Council of Italy, the study introduces IceBoost v2.0. The machine-learning model estimates glacier thickness across the globe, excluding the main polar ice sheets.
The work uses more than 7 million ice-thickness measurements. It combines those records with 26 physical and geometric variables to estimate thickness point by point.
Glaciers may look simple from the surface. You see white ice, broken crevasses, gray rock and meltwater streams. But the most important part often remains hidden below.
To understand a glacier’s future, scientists need to know its thickness. That thickness helps reveal how much ice can melt, how fast a glacier may retreat and how much water it stores.
“The distribution of glacier ice thickness is a fundamental variable for glaciological and climate models,” said Niccolò Maffezzoli, physicist and researcher at Ca’ Foscari University of Venice and affiliated with CNR-ISP.
“To predict how glaciers will evolve by 2100 and quantify their contribution to sea-level rise, we first need the most detailed possible picture of their current state,” Maffezzoli said.
That current state is changing quickly. Glaciers have lost about 5% of their mass over the past two decades. In some regions, losses have reached 39%.
Directly measuring glacier thickness is difficult. Researchers often need radar surveys from aircraft or field teams crossing dangerous ice.
Those surveys provide valuable data, but they cover only a small share of the world’s glaciers. IceBoost v2.0 fills the gaps by learning patterns from measured glaciers.
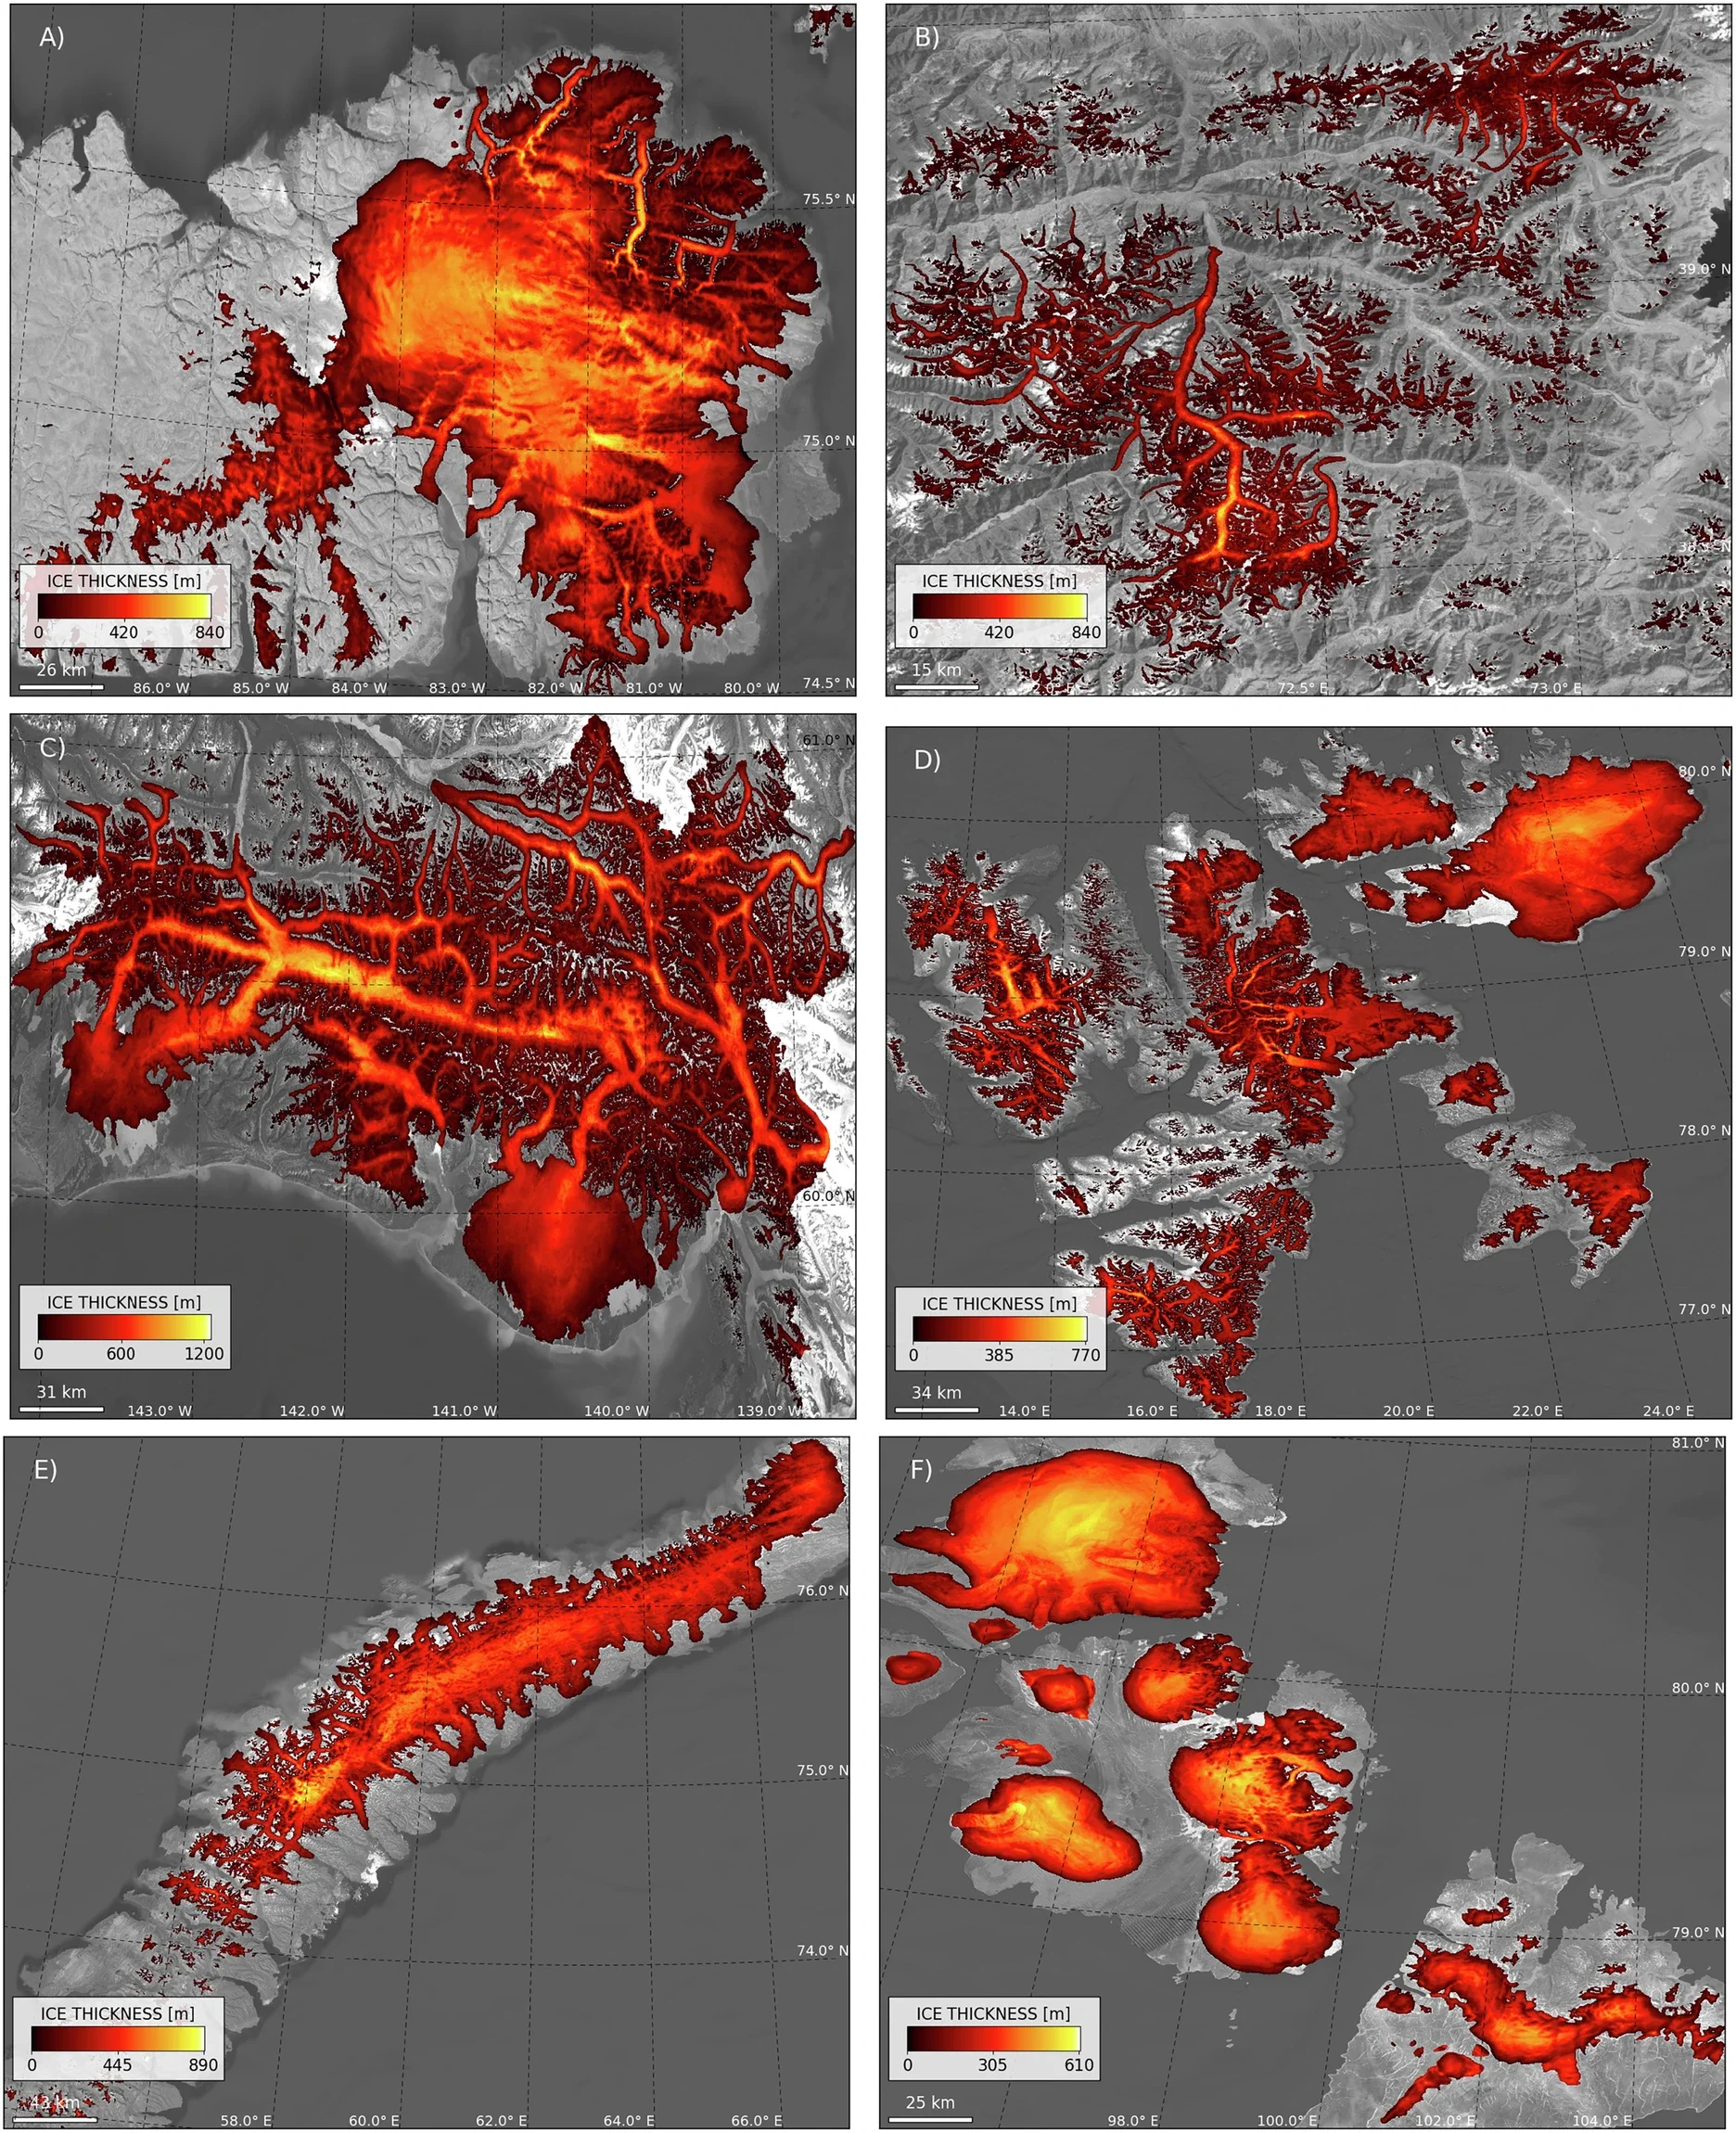
The model was trained on more than 7 million measurements from public and regional datasets. These included data from Alaska, Scandinavia, Patagonia, the Canadian Arctic, coastal Greenland, Svalbard and Antarctic margins.
After strict quality checks, the team used 378,373 gridded data points for training. This step helped avoid giving too much weight to places with especially dense survey lines.
The model combines two machine-learning systems, XGBoost and CatBoost. Both use decision trees that improve step by step as they learn from data.
IceBoost v2.0 does not estimate thickness from location alone. It uses 26 variables tied to glacier shape, climate and movement.
Those inputs include slope, curvature, elevation, temperature, surface mass balance, distance to glacier margins and ice velocity. Slope matters greatly because flatter glacier areas often hold thicker ice.
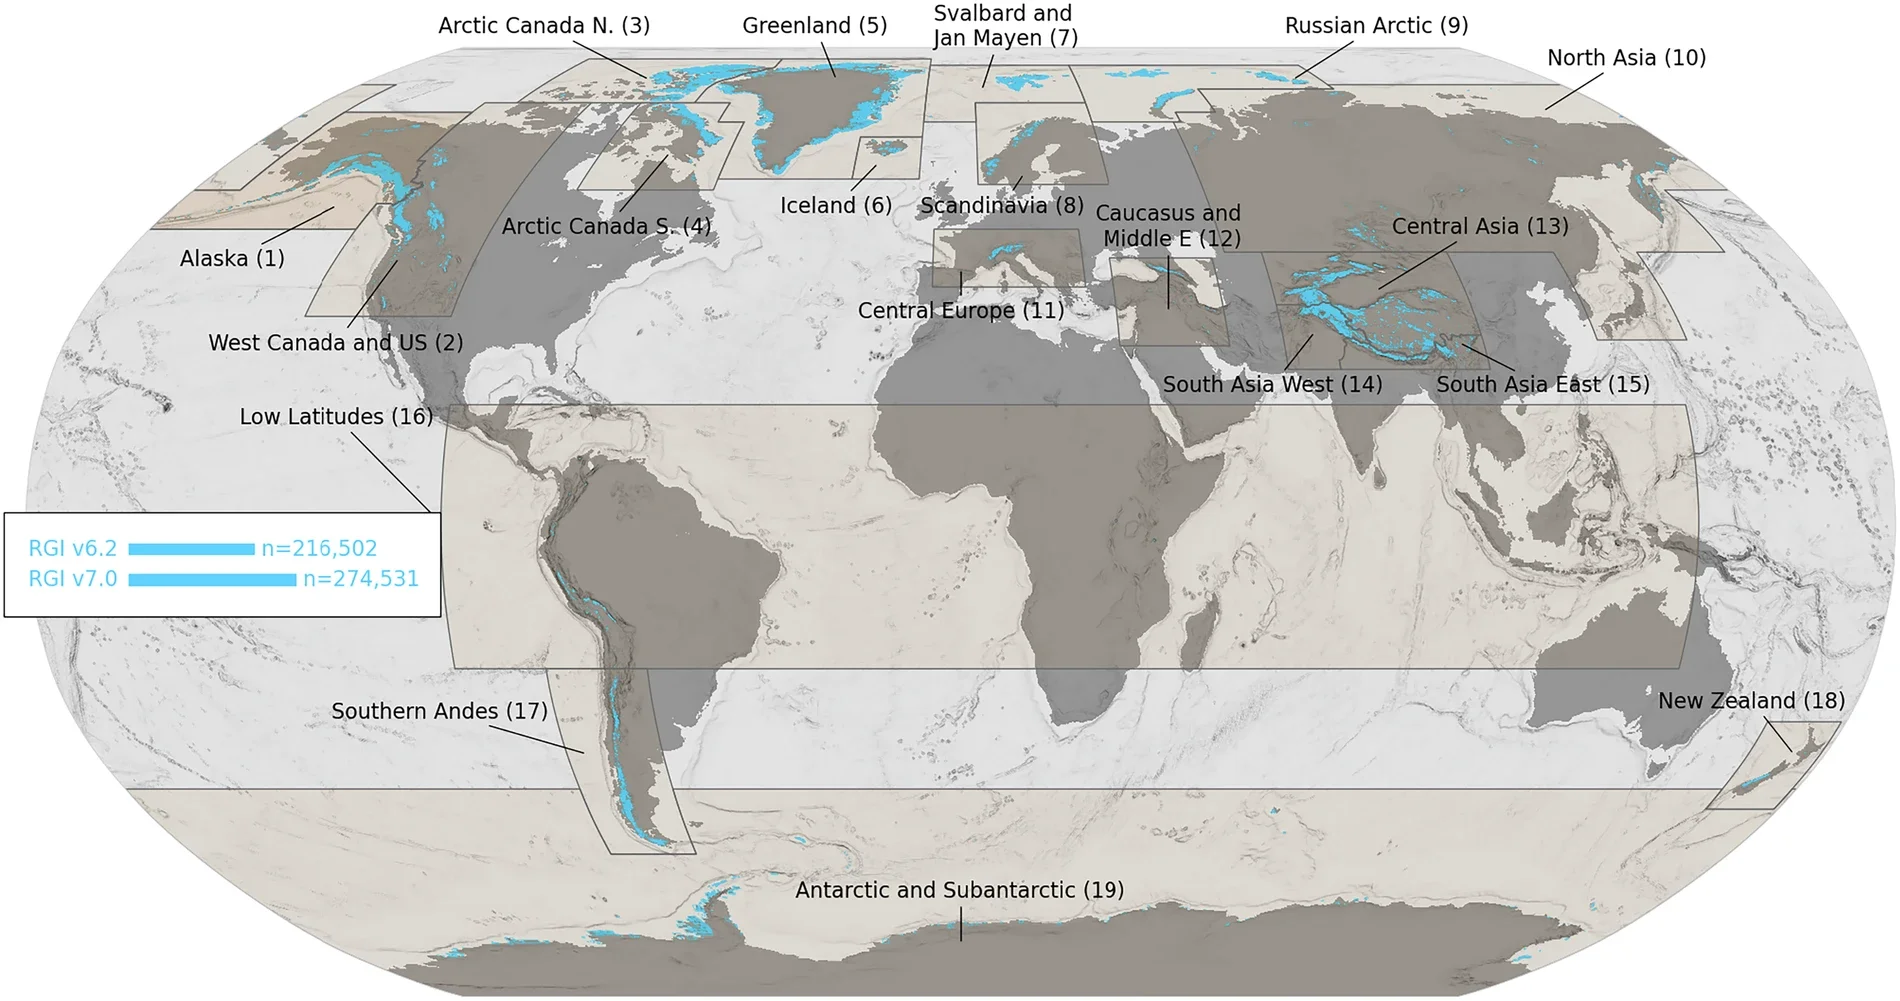
The model also uses updated glacier outlines from the Randolph Glacier Inventory, known as RGI. This global inventory maps glacier boundaries around the world.
The study modeled 215,547 glacier outlines in RGI version 6.0. It also modeled 274,531 outlines in RGI version 7.0.
The newer inventory includes many updated boundaries. That matters because small mapping errors can change volume estimates, especially near rock outcrops inside glaciers.
For RGI version 6.0, IceBoost v2.0 estimated global glacier volume at 150,000 cubic kilometers. The uncertainty was 38,000 cubic kilometers.
For RGI version 7.0, the estimate was 149,000 cubic kilometers, again with an uncertainty of 38,000 cubic kilometers.
Those totals match earlier global estimates closely. Previous studies placed total glacier volume near 141,000 and 158,000 cubic kilometers.
But the new model improves the local picture. The researchers report that IceBoost v2.0 matches field observations up to 40% more accurately.
That added detail can matter more than the global total. Communities, rivers and hazards depend on individual glaciers, not just worldwide averages.
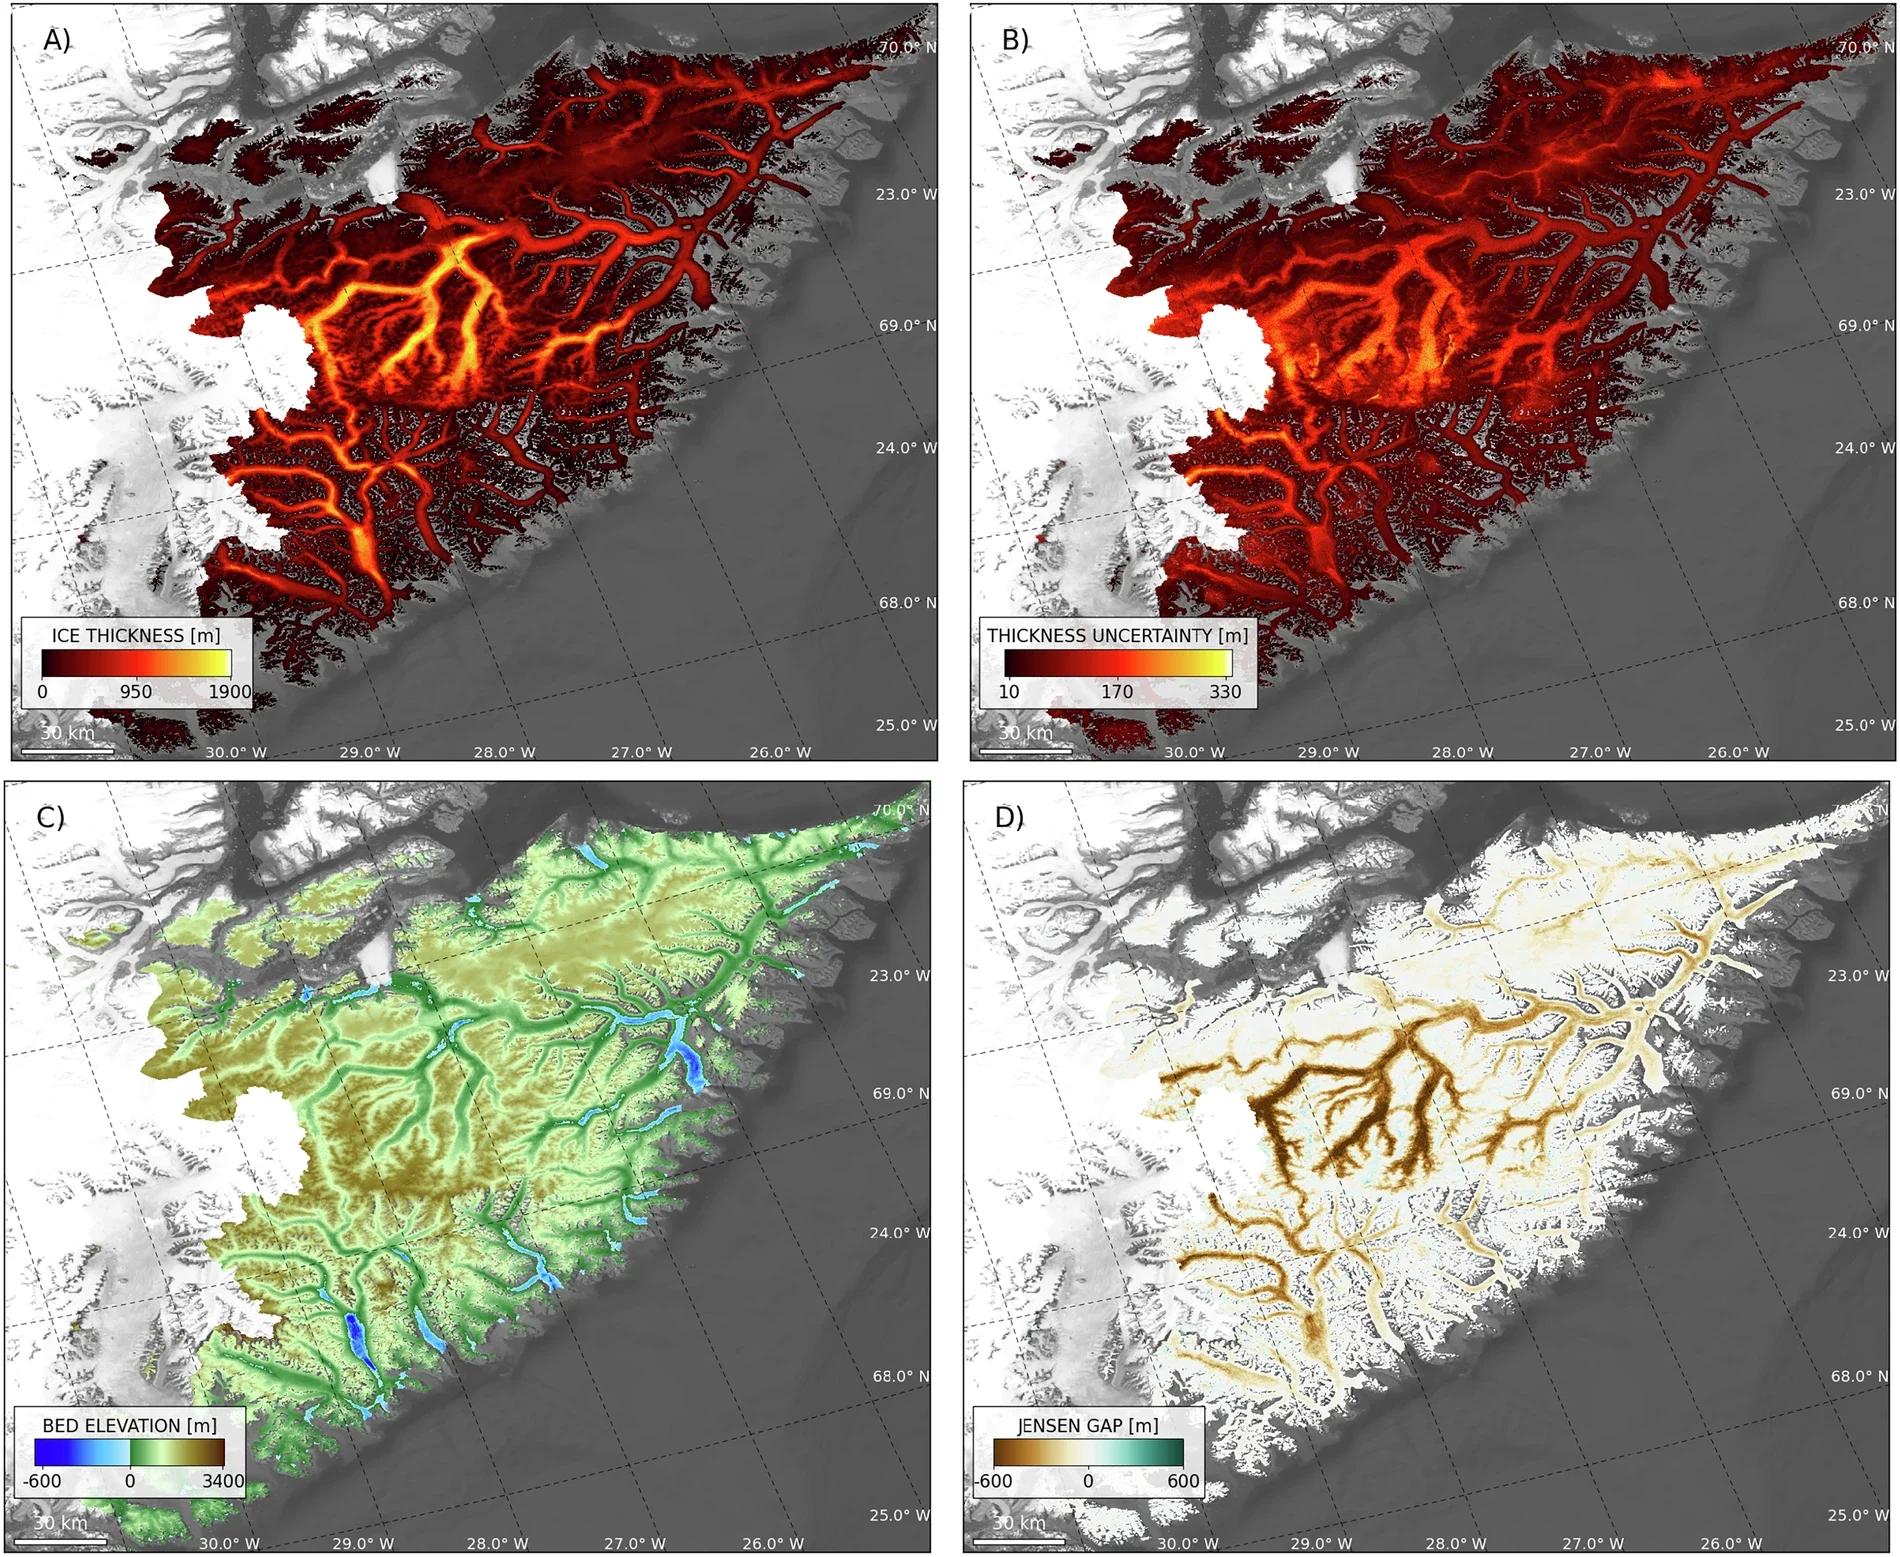
One striking result came from the Geikie Plateau in eastern Greenland. There, IceBoost v2.0 found ice as thick as 2 kilometers.
The model estimated nearly twice as much ice in that area as previously reported. That difference shows how much hidden ice may still be poorly mapped in some regions.
The Geikie Plateau is connected to the Greenland Ice Sheet. That makes it a difficult and important region to study.
Glaciers near ice sheet margins can have complex shapes and limited measurements. Machine learning can help fill those gaps when enough related data exist.
Still, the study does not claim every region is equally certain. Confidence depends on data quality, terrain and how well glacier outlines are mapped.
IceBoost v2.0 also highlights where scientists need better observations. This is one of the dataset’s most useful features.
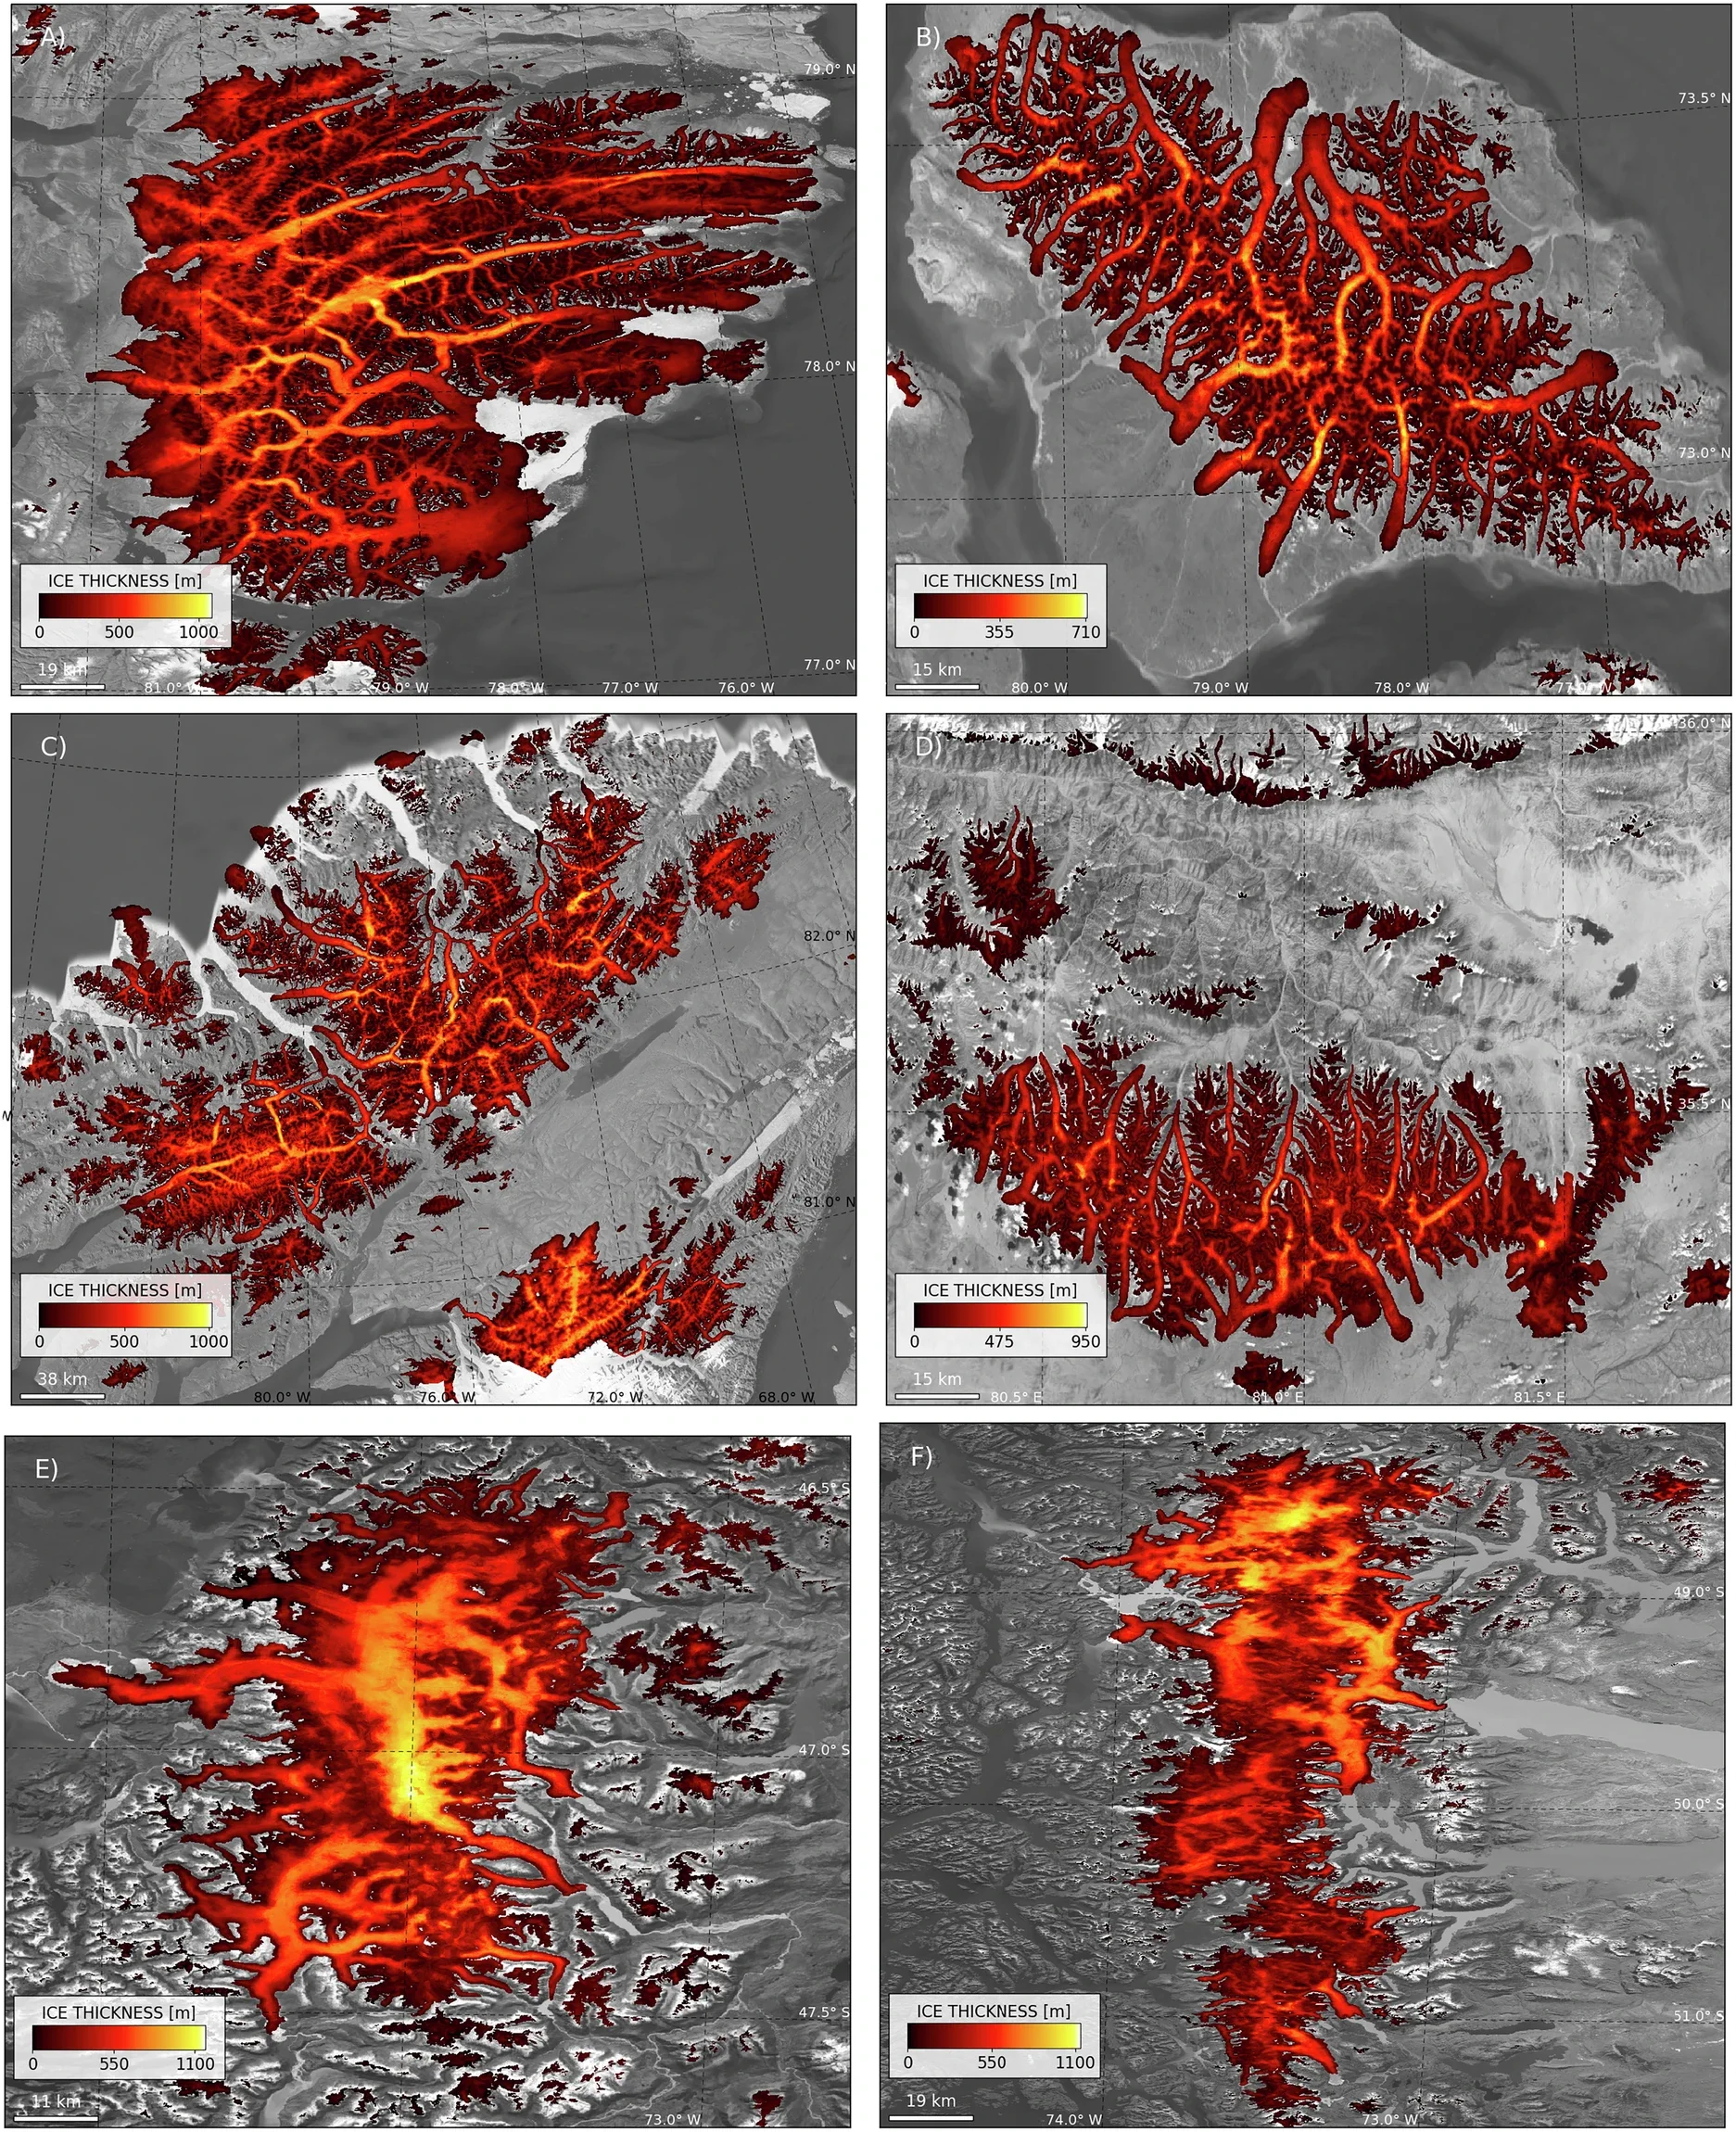
The maps show regions where estimates are reliable. They also show areas where uncertainty remains high.
The Himalaya, Karakoram and major Patagonian ice fields need more measurements. These regions matter for water supplies, hazards and climate projections.
Better field data could improve future versions of the model. More observations would also help scientists test where machine learning performs well.
The dataset includes uncertainty maps for each glacier. That allows researchers to see not only what the model predicts, but how confident it is.
Glaciers do more than raise sea level when they melt. They also sustain rivers, farms, ecosystems and communities.
The study notes that glacier-fed systems support about 1.9 billion people worldwide. In many regions, seasonal meltwater helps buffer dry months.
That role becomes especially important in arid and desertifying areas. Parts of South America may face growing water stress as ice reserves shrink.
Better estimates of thickness and volume can improve projections of future freshwater availability. They can also help governments plan for changing river flows.
A glacier is not just frozen scenery. For many people, it is stored water, future risk and present-day support.
The new dataset will support future glacier simulations. Researchers involved in GlacierMIP4 will use IceBoost v2.0 as their sole representation of present-day glacier conditions.
GlacierMIP4 is producing the next generation of glacier projections. Those simulations will help inform IPCC assessments of glacier change through 2100.
Accurate starting conditions are essential. If models begin with the wrong ice thickness, their future projections can drift off course.
IceBoost v2.0 gives researchers a more detailed baseline. It can help estimate future sea-level rise, meltwater changes and glacier retreat.
Future glacier loss could be severe. The study notes that projections show glaciers may lose 26% to 41% of their mass by 2100.
Maffezzoli said glaciers remain difficult to model, even though scientists understand much of the physics.
“Glaciers are highly complex systems. Although the governing physics is well understood, many of the parameters involved in the equations remain unknown, poorly constrained or extremely difficult to measure,” Maffezzoli said.
Machine learning offers another route. Instead of imposing every physical rule, it learns directly from measured examples.
“Machine-learning models offer an alternative approach: they learn directly from data, generating predictions without imposing a predefined physical description,” Maffezzoli said. “When sufficient data is available, this approach often proves highly effective.”
He said the future likely lies in hybrid models. These would combine physical understanding with direct learning from measurements.
“We must move quickly: glaciers at mid-latitudes, including those in the Alps, are expected to disappear within the next few decades,” Maffezzoli said.
This research can improve predictions of sea-level rise. By mapping glacier thickness more accurately, scientists can better estimate how much ice may enter the ocean this century.
The findings also matter for freshwater planning. Glacier melt supports rivers, crops, hydropower and drinking water for many communities. Better ice-volume estimates can help regions prepare for future shortages or seasonal changes.
The dataset can guide field campaigns. Scientists can use the uncertainty maps to decide where new radar surveys would make the biggest difference. That can save time, money and effort in remote or dangerous terrain.
For humanity, the study offers a clearer view of a shrinking resource. Glaciers affect coastlines, water security, ecosystems and mountain hazards. IceBoost v2.0 gives researchers and decision-makers better tools to understand what is being lost and what may come next.
These resources examine how fast glaciers are shrinking, how future warming could reshape global ice reserves, and what those changes mean for sea levels and freshwater supplies.
Community estimate of global glacier mass changes from 2000 to 2023
This global assessment found that glaciers lost about 273 billion metric tons of ice per year from 2000 to 2023, with losses accelerating substantially during the period. It provides one of the most comprehensive recent measurements of the glacier decline that thickness models aim to track. (Nature, 2025)
Glacier preservation doubled by limiting warming to 1.5°C versus 2.7°C
This global modeling analysis examines how different long-term temperature levels affect glacier survival, mass loss and sea-level contribution, showing how strongly the amount of ice preserved depends on future warming. (Science, 2025)
Irreversible glacier change and trough water for centuries after overshooting 1.5°C
Researchers modeled the consequences of temporarily exceeding 1.5°C of warming and found that glacier mass and runoff can remain altered for centuries even if temperatures later decline. The work connects glacier loss directly with long-term changes in freshwater availability. (Nature Climate Change, 2025)
Global glacier change in the 21st century: Every increase in temperature matters
This major global projection estimated that glaciers could lose about 26% to 41% of their 2015 mass by 2100 under different warming scenarios, demonstrating why accurate present-day glacier thickness and volume estimates are critical starting points for future projections. (Science, 2023)
Importance and vulnerability of the world’s water towers
This global analysis ranks mountain water systems according to their importance for downstream ecosystems and societies, highlighting regions where communities depend heavily on snow and glacier-fed water and where those supplies face substantial pressure. (Nature, 2020)
Research findings are available online in the journal Scientific Data.
The original story “AI maps ice levels beneath the world’s glaciers – could raise global sea levels by over a foot” is published in The Brighter Side of News.
Like these kind of feel good stories? Get The Brighter Side of News’ newsletter.
The post AI maps ice levels beneath the world’s glaciers – could raise global sea levels by over a foot appeared first on The Brighter Side of News.


Leave a comment
You must be logged in to post a comment.